shaggybaxter said..Hi Dachopper,
I was reviewing your dashboard and just wanted to say.. well done!
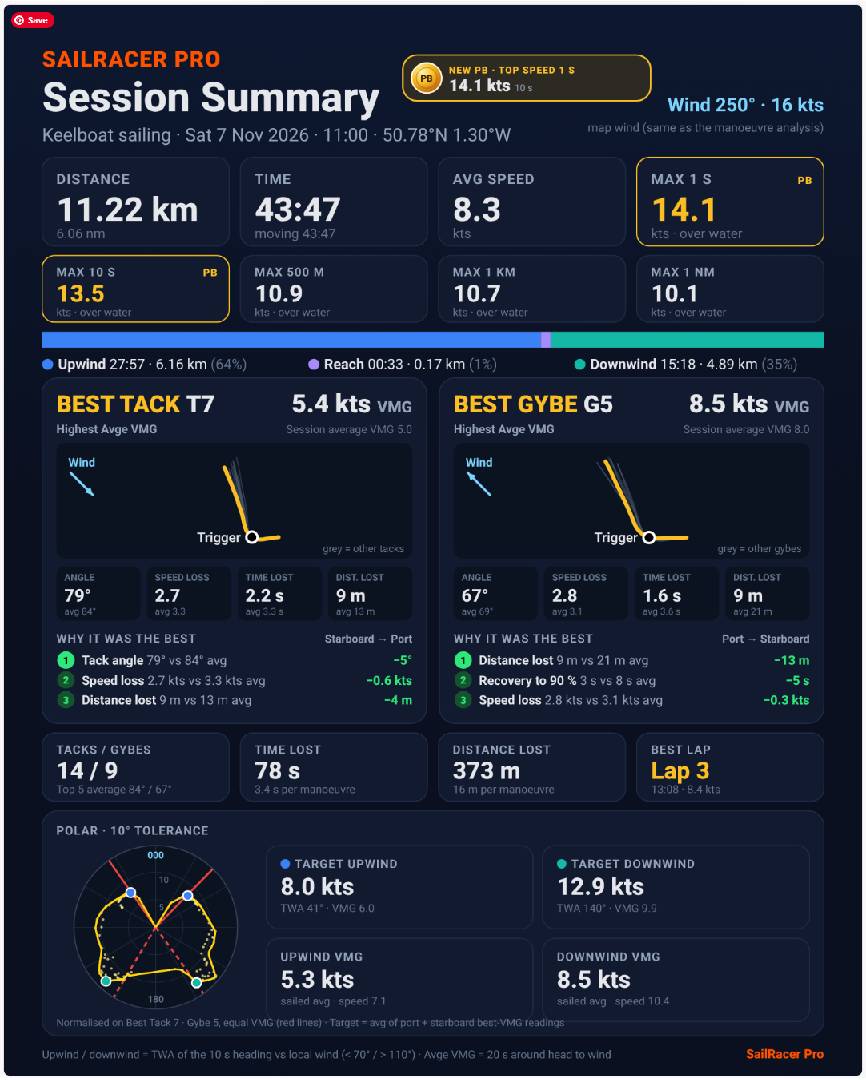
I'm seeing a lot of 'Vibe coding' at the moment where people are using AI to generate dashboards of all sorts of stuff, like business performance dashboards, system monitoring dashboards, logistics dashboards to name a few.
AI is getting so good it has this propensity to generate a ridiculous amount of cool numbers, counters and graphs. Whilst this might be uber cool for a sys admin, this is far more likely to be a negative for the large majority of users, as it simply overloads your ability to digest.
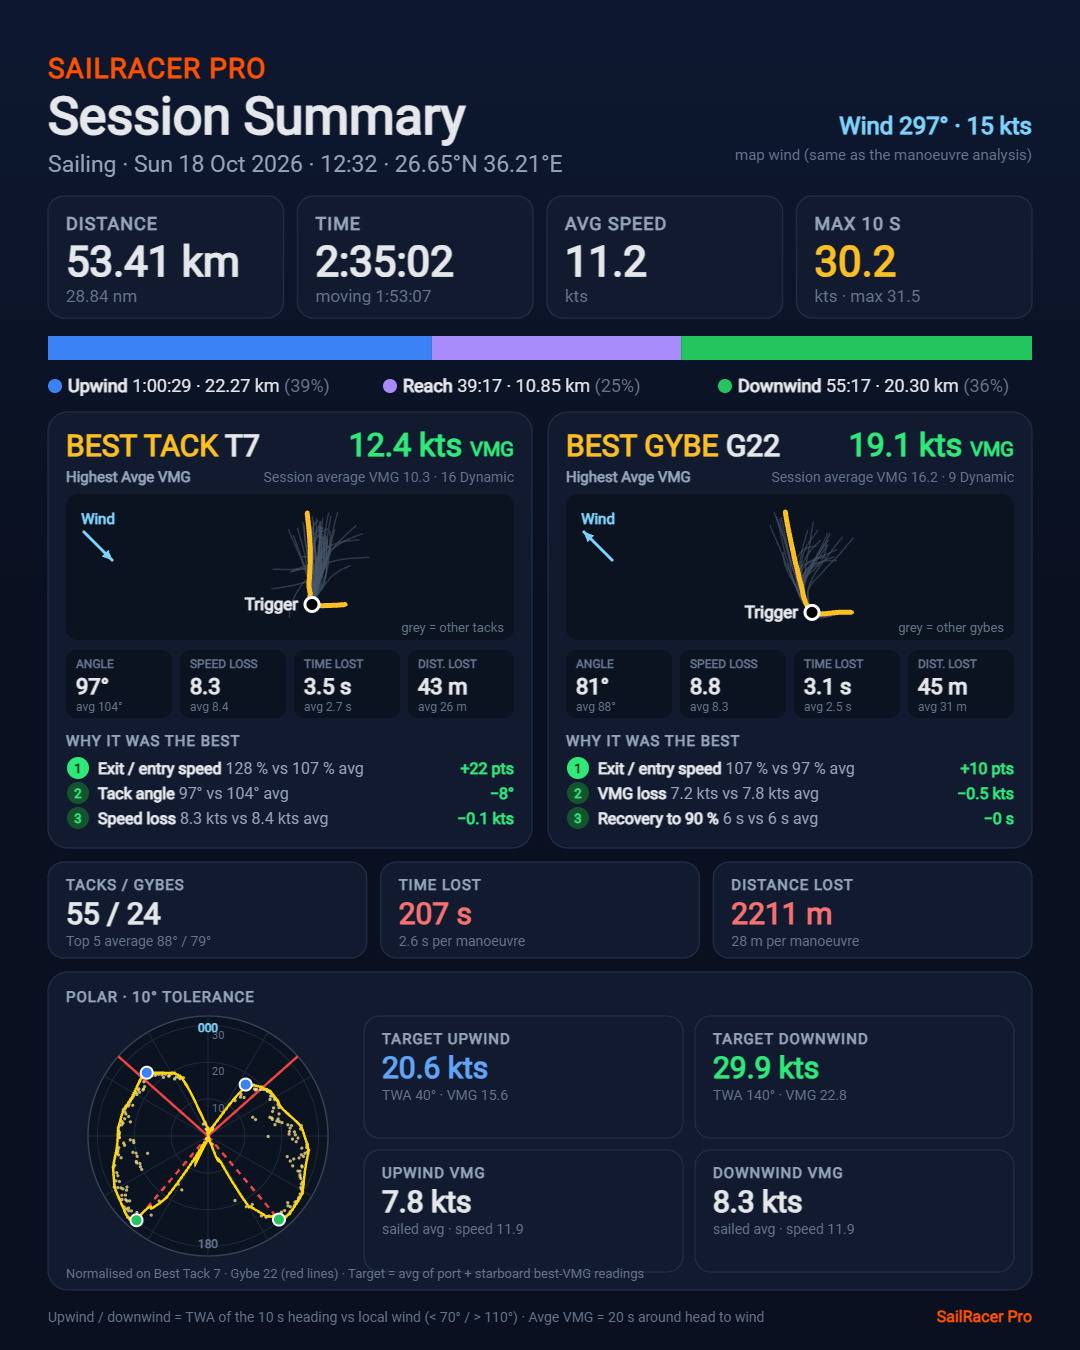
I can see a lot of thought has gone into your dashboard to parse all of the noise and try and present useful and informative information.
Full credit to you mate, nice work.
One observation, just something that jumped off the page at me.
In the 'Best Tack and Best Gybe' section, I noted T7 was the best tack. The my brain went straight to "Hmmm. I wonder what were my Best 5 tacks? Were they all around T7? Were they completely random tacks? Were they all on the right hand side?"
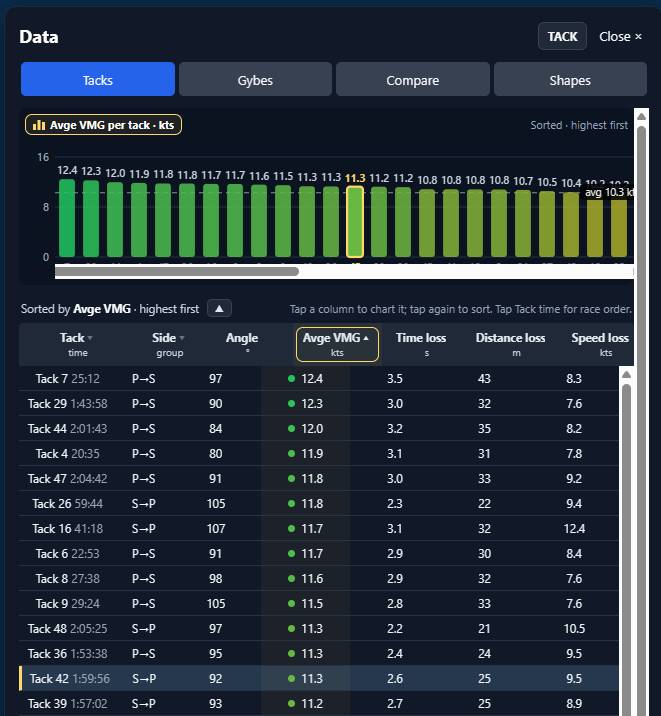
I would find useful a Top 5 list of gybes/tacks. That would be a cool data set to have.
(Apologies if you do already and I'm just ignorant.)
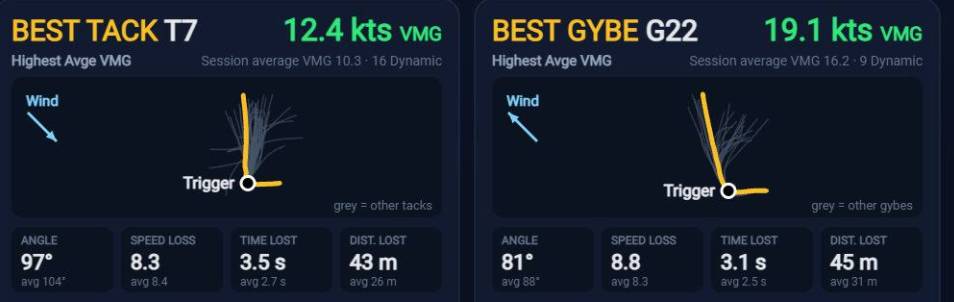
Thanks Shaggy,
It has been an up mountain battle!
I've just uploaded sailracerpro.com 6.0 , probably 6.1 by end of today, and updated all linked Garmin watch apps to support.
However Garmin and Microsoft Servers are down for some odd reason.
I added auto-emailing of the session sumamry as soon as the website recieves it from the watch, but maybe another couple days for the servers to get fixed - everything looks ok on my end.
Hours of iterations to get the displays right for sailing !
There is a seperate one for kitesurf aimed at jumping, and I was thinking about parawinging but I'm not sure what info those guys are after exactly.
If you click on the sumamry card - it takes you to the Tack analysis sheet and cues up the replay at the selected Tack. At the moment, the view order is the replay order it occured in ( for tack analysis ) ,
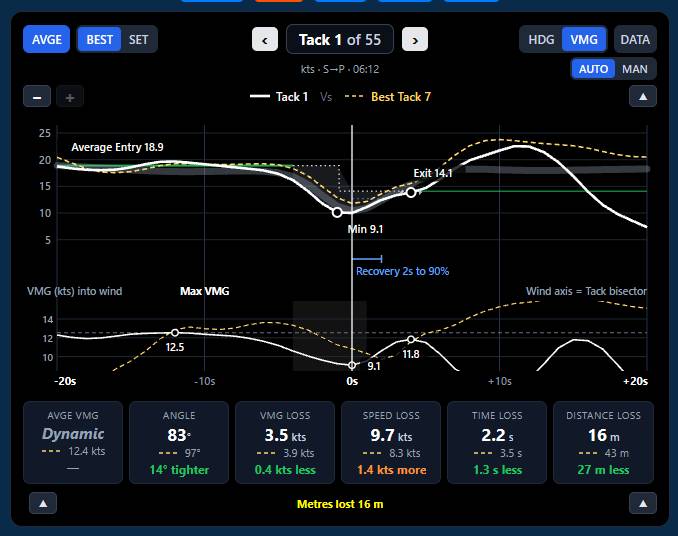
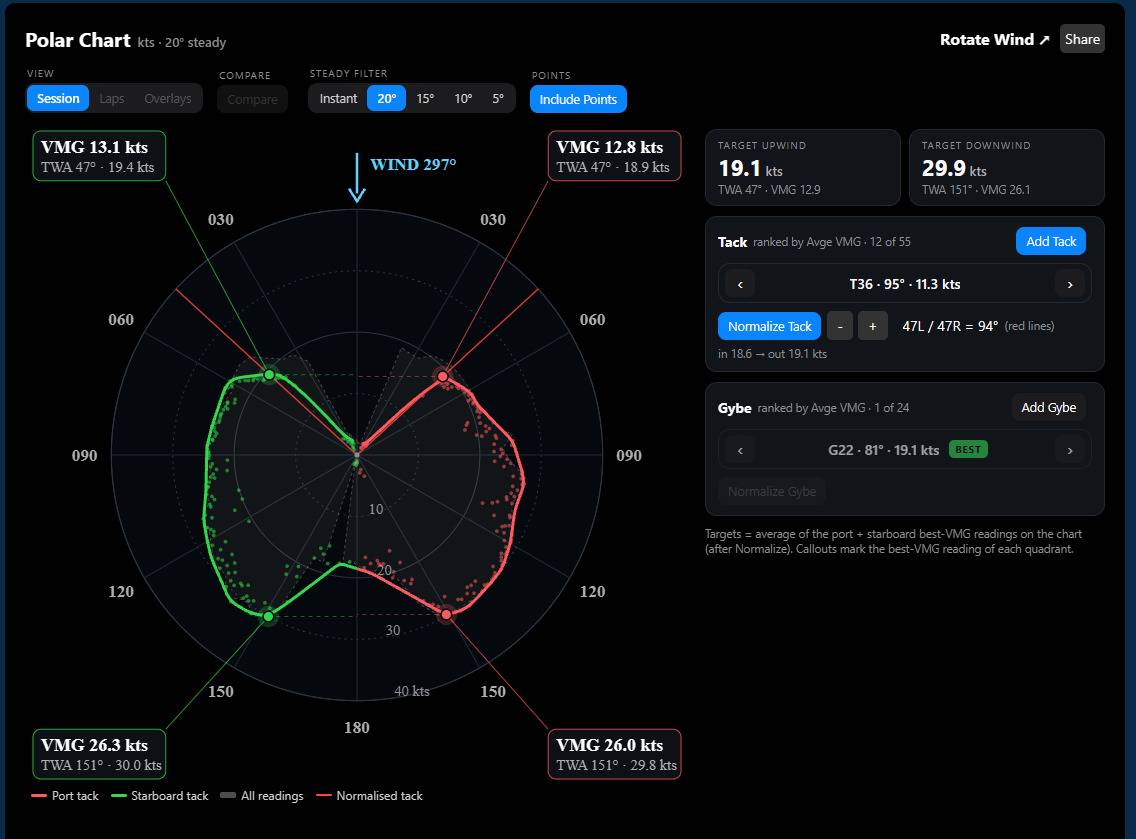
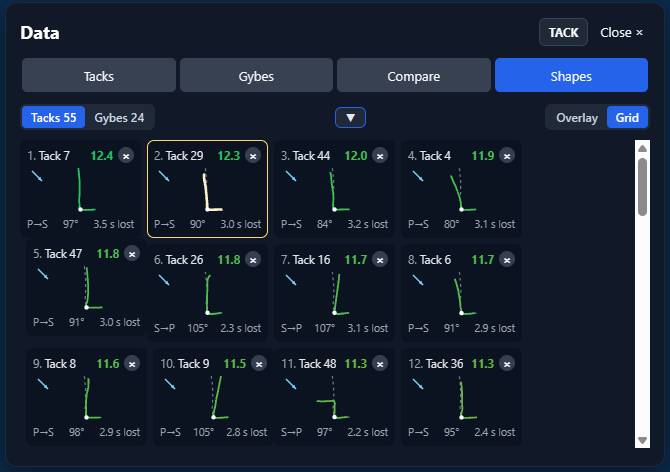
but I also have a Data tab, which ranks all the tacks in order of best to worst, clicking syncs the replay
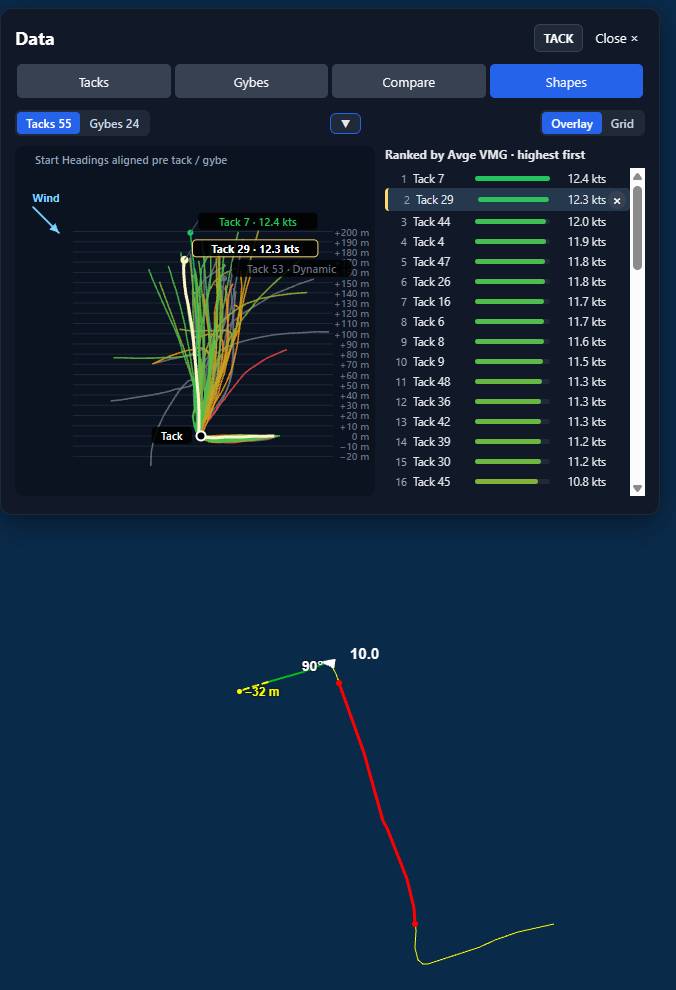
... also has a shape and grid view of the tack where you can go down the best -> worst list.
finally, I did a few tweeks to the summary colours also, Gold for PB, white otherwise.