hi,
Jake here again with an autumn 2026 update to my 18 month old post:-
"A response to Poor Results in a Port Phillip Heads Slack Water Quiz".
I tried to append this update to the bottom of that post but SeaBreeze said:- No, it is too old - you will have to make it a new topic!
Basically that old November 2024 post announced that my extensive work in explaining the correct quiz answer had all been wrapped up in a personal web site that the post linked to.
This new update is mainly to address some "search engine result blocking" that has been taking place against that website since the beginning of summer. Since I was forced into making a new post, I've added a new bit about the "Queenscliff Cut".
If none of what you have read so far makes any sense, you probably were not involved in the prior posts and won't have much context. If this is the case it might be best to click away now - unless you actually sail / boat / fish / dive around Port Phillip Heads, in which case you might want to keep reading!
The intended update text starts here:-
*** WEBSITE ***My mini-website on tides and currents in Port Phillip is working well, and has grown by a few more web pages. However:-
*** SEARCH ENGINE ISSUES ***Over much of the current boating season I have been driven insane by search engine issues with both Bing and Google. These were initially technical issues, with the blame shared roughly equally between those companies and the total novice web-guy - me! Then in high summer various "blocks" and "de-rankings" were put in place on some pages by an unknown third party.
I could see that many folks have been frustrated by searching for something they have heard exists, but is then not reported in search results. I apologise for this search frustration, particularly for Bing users, but it was something outside my control.
I am fed up with all this access nonsense which also seems to vary over time. I don't have the technical skills to exactly identify what is going on, who initiated it, or how to counter it. I have asked Ports Victoria if they were involved in the blocks but they didn't respond to that particular question. However they have invited me to a meeting with the Harbour Master in a couple of weeks to discuss my concerns about their official tidal streams advice.
*** SEARCH ENGINE BYPASS ***The solution to overcome any "can't find that page" blocks is to bypass invoking a search engine query in your browser and instead directly enter the actual web page URL into your browser's address bar. From the URL table further below you can:-
1) copy the link text to the clipboard (stopping before the first space)
2) create a new browser window
3) paste that link text into the address bar of that new window
4) open the link in the new window
Web page URL text: ..............................................
Comment:jake-h5.neocities.org/PPH-Slack-Water ...Best place to see the reasons behind the right slack water quiz answer.
jake-h5.neocities.org/3BadBoys ...............Looks at 3 dangerous Port Phillip Myths that you should NEVER BELIEVE.
jake-h5.neocities.org/Equal-Levels ..........Detailed look at PPB's key tidal moments:- "Equal Levels" & "Slack Water"
jake-h5.neocities.org/H2oSlopes .............Includes a bay-wide look at sea level slopes through 24 hours of tides.
jake-h5.neocities.org/ .............................This Index Page has a bit about:- PPB Tides, me, & links to other pages.
*** WHAT AM I TRYING TO ACHIEVE ? ***The short answer is safer recreational boating around the Heads by killing off three "bad advice Myths". Fortunately the most widely believed "Bad Myth" is the least dangerous one, and the two very dangerous ones are less widely believed.
However the aim is to try to knock off all three! This should result in a better, more accurate, and safer "official story" told about Port Phillip Heads by all government agencies. I think I am making slow progress in that aim, but my earlier hopes of "sensible science" quickly sweeping "all the crap" aside did not quite go to plan! Hopefully some progress will be made at the upcoming meeting with Ports Victoria.
MYTH #1)The present official PPH advice of "slack water occurs when the inside and outside levels are equal" has been in place for a very long time but it is bunkum. Not one shred of evidence exists to support this, with the problem being it simply ignores the large dynamic forces required to accelerate and then later decelerate the enormous mass of the moving water involved in PPH tidal streams.
Most folk are happy to accept Myth #1 at first glance, because when the inside and outside levels are the same, there is no gravitationally produced horizontal pressure gradient to drive water one way or the other through the Heads. However, "zero driving force time" does not imply a "zero speed time" if the tidal stream has any residual momentum at that point.
At Port Phillip Heads tidal streams typically have between 1 - 2 knots of speed left in them by the time the (equal levels / zero drive) time is reached. This allows them to continue flowing forward for quite a while until all the forward momentum is dissipated. The official "simplified view" is not harmless as its untrue statements lead to an incorrect understanding of how the current speed changes with time over the slack water window. These sketches of "current speed vs time" show the potential for harm around slack water time for Myth #1 believers.
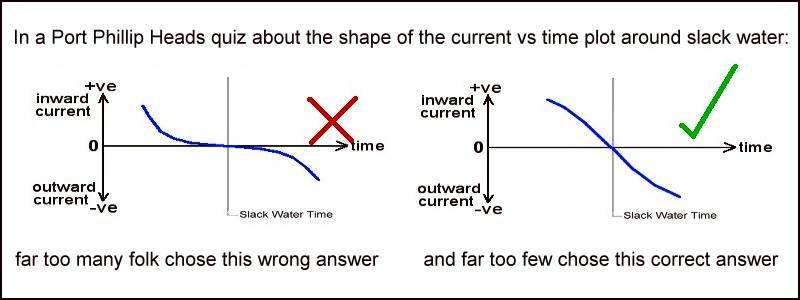
Most sailors would have heard of the "rule of twelfths" used to estimate rising or falling tide heights over each elapsed hour. For tidal currents, the less well known but handy approximation is "
the 50/90 rule". More specifically:- A tidal stream (ie. current) will build to 50% of its final maximum strength over the first hour, and then to 90% over the second hour.
All I am trying to do is reinforce that during that first hour the growth in speed is nearly linear ie. it steadily grows by roughly an additional 1/12 of the maximum speed every ten minutes. For example if the BoM Rip prediction tables show the max Rip flow rate is 6 knots, then the rate of change in current strength within an hour or so of the following slack water is almost steady at about 0.5 knot/10 minutes. ( If the BoM max speed rates before and after that slack are quite different, then best to average their strengths before dividing by 12.)
MYTH #2)A few scuba diving organisations and individuals still insist that for locations well inside the Heads, slack water is delayed behind slack water at the Heads by the same time delays that the Hi/Lo tide moment suffers between the Heads and that location. This is also total bunkum and is very dangerous advice because for many "well-inside" scuba diving locations that procedure gives times close to the maximum strength of the reversed tidal stream.
Tide heights and tidal streams are very different things. They can behave very differently. Inside Port Phillip Heads, the "Hi/Lo tide" moment advances at roughly 6 kph over the 18km distance to the Bay's "main body" region. In contrast the "Slack Water" moment zooms across it at roughly 100 kph. The Australian National Tide Tables (ANTT) says there is "zero slack delay" between the Heads and Hovell Pile but theoretically it is around a dozen or so minutes and not the several hours Myth #2 promotes.
Folks who insist that the northward water inflow across the Great Sands continues for 2 - 3 hours after the ebb outflow starts at the Heads should think about where on earth that water could be going, given that all north Bay tides are known to begin dropping soon after the outflow begins at the Heads. Myth #2 just does not make any sense and is very dangerous. I once rescued a man who was on the verge of drowning because he believed in this myth.
The main player still putting this myth out there is "The Scuba Doctor" website. I've had three recent visits to the dive shop, attempting to have a face-to-face conversation with the new owner of this diving business. No such luck. My 75 year old brain was stunned by a young dive shop staffer who said words to the effect:-
the previous owner's website is presented as a "free service", and therefore we have no obligation to correct any false or dangerous information in it.
Luckily as I shuffled across the car park shaking my head in disbelief, I was chased after by another individual who seemed to be their part-time "web-guy". He gave me his email address and said he would look into taking the bad parts of their article down if I sent him the details. Still waiting Ashley!
The extra reason I'm so peed off with this mob is that because of high traffic volumes to that website (an on-line business and a very comprehensive "dive site list" ), the false and dangerous slack water timing advice usually pops up in the first page of results from a PPH tides search. Sometimes it even gets swept up into those dreadful and often dangerous AI overviews of PPH slack water.
MYTH #3)Total newbies and some visitors to Port Phillip often think it is safest to enter Port Phillip just after low tide at the heads and "ride the first of the flood tide through". This is also bunkum and extremely dangerous. This is the worst possible time to attempt to enter Port Phillip, as it puts you in the maximum of the ebb current (4-6 knots) often with a dangerous breaking sea.
*** AVOIDING CONFUSION ***Locals and visitors alike must try to sever any mental connection that always associates a rising tide with a flooding tidal current. Tidal currents are always associated with rising or falling tides
SOMEWHERE, but not necessarily where you are! Often it is over some large water area, far away from your location, and perhaps even beyond your visible horizon. This is indeed the case for the very large Port Phillip Bay.
So near Port Phillip Heads, for about 50% of the time we have either a rising tide but with an outgoing current, or a falling tide with and ingoing current. If you are still confused by all this, best to look at the tidal height & tidal current animation of the Bay given about 30% down the first web page listed in the previous table of URLs.
*** INTERESTING SIDE NOTE ON SWAN BAY AND THE QUEENSCLIFF CUT ***Swan Bay is a smallish and shallow "side bay" buried in the SW shoreline of Port Phillip near Queenscliff. It is about 8km long by 2km wide and has
two connecting channels to PPB proper. Here is a location map:-
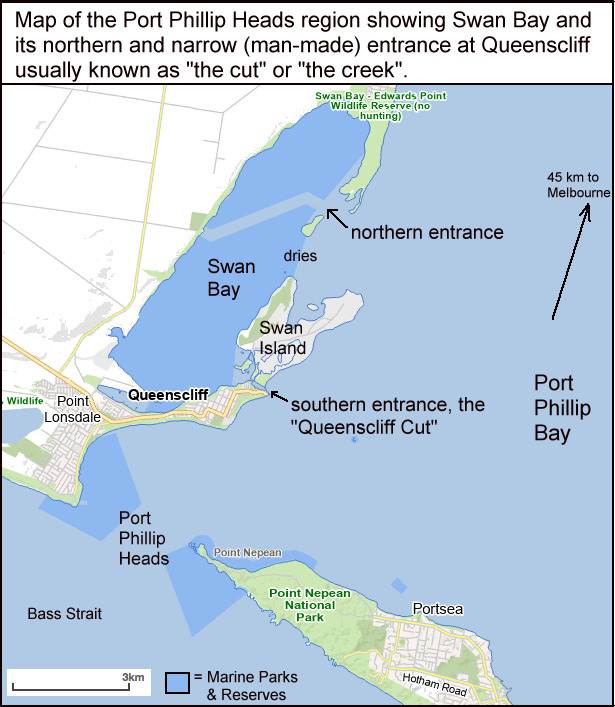
The northern (natural) entrance to the Bay is about 1km wide. The southern entrance is a man-made "Cut" (sometimes called "the creek") is about 30m wide and 500m long. Tidal currents here can be 3+ knots but often it feels faster because of the narrow channel and the unyielding rock walls on one side and timber wharves on the other. It is used by boats both big and small to access Port Phillip Bay proper. It can be a confined and dangerous place with the current running hard and sadly it saw a drowning in 2024.
*** SO WHEN DOES SLACK WATER OCCUR IN THE QUEENSCLIFF CUT? ***Well although the currents do run fast through this narrow channel, it's small size mean the water mass flowing through The Cut in each tidal cycle is really quite tiny compared to Port Phillip Heads massive flows. This means we might expect the degree of time overshoot beyond the Equal Levels moment due to water momentum effects to be quite small compared to the long overshoot times exhibited by tidal streams through Port Phillip Heads.
This is observed to be the case. Slack water in the Queenscliff Cut, at least in low wind conditions, occurs close to the Bay's "Equal Levels" moment when the level difference between the outside and inside waters passes through zero and from the current's perspective changes from down-slope to up-slope. Because the northern entrance of Swan Bay is about 5km further into Port Phillip, the relative water height difference between the two entrances also changes sign at the "Equal Levels" moment and so leads to a flow reversal in The Cut. This happens roughly 30 to 80 minutes BEFORE slack water occurs in PPB's entrance and major channels. This timing simply cannot be explained under the old "official story".
The Queensciff boat ramp has several "Ramp-Cam" views near the Swan Bay end of "The Cut". Unfortunately the best view of the waterway has unreliable image capture intervals, meaning a less favourable "car park view" has to be used to get reliable regular snaps that can show in near real time, and from a remote monitoring location, how the moored boats and unoccupied moorings shift as the current reverses.
Here are some examples:-
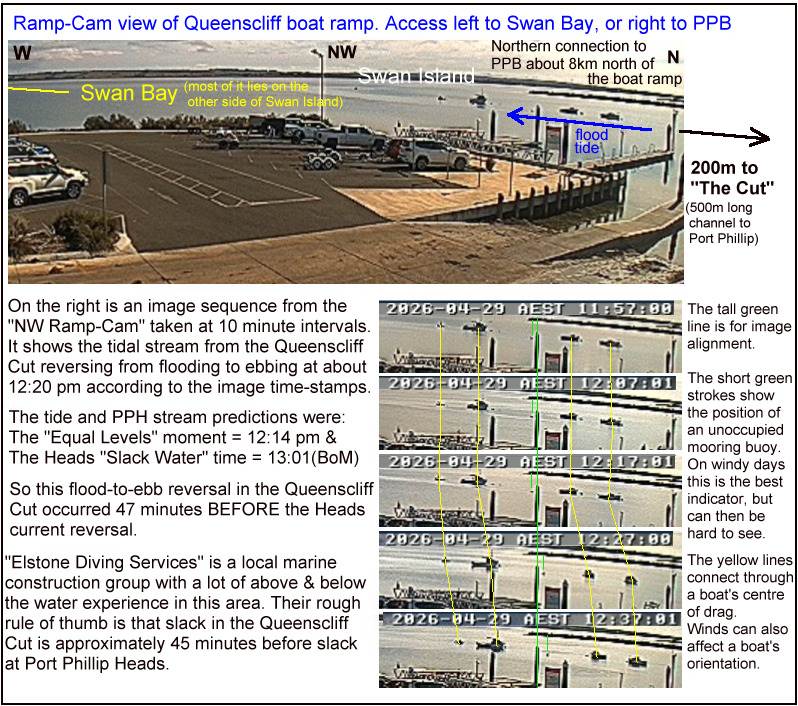
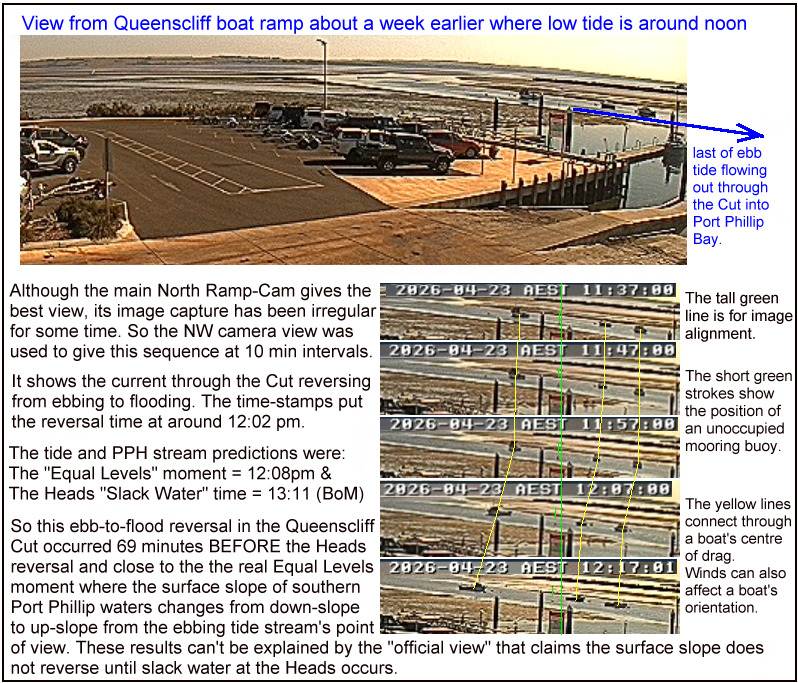
Note in days of strong winds and/or big barometric pressure changes, the "slack in The Cut" times don't align so well with the "Equal Levels" times. Nevertheless in all cases slack here still occurs well before slack at the Heads.
Under Myth #1 many folks might expect that slack in The Cut should be the same time as slack at the Heads because they think the surface slope in the southern Bay waters reverses at Heads slack water time. This may lead to estimates of slack in The Cut being up to an hour too late, with the current running at around 50% of its maximum rate.
Worse still, some adherents to Myth #2 will claim that slack in The Cut will be one hour after slack at the Heads, because the (irrelevant) Hi/Lo tide delays for Queenscliff is on average around one hour after Hi/Lo at the Heads. This leads to estimates of slack in The Cut to be up to two hours after it has actually occurred. Under the 50/90 rule this bad advice may be claiming "slack" when in fact The Cut is running at near 90% of its maximum speed.
cheers,