
Curious about the changes to the App, and why?
It's been 30 years - read the background story here.
Recover access at /Forgot using your account email (or member name).
Try /Forgot, then Feedback with enough details to verify the account.
When you no longer know the login name, password, and cannot use the old email, self-serve recovery may not be enough.
We can only restore access when we can reasonably verify the account is yours.
See the main forgot login / email help article.
This topic is covered in the main recovery article.
→ Forgot my login name / my email!
Short version: go to /Forgot and use the email address on the account.
Change your account email in Account Tools (/Member/Tools#email).
Update the email address on your account from Account Tools.
#email on that page).You can also use /Member/ChangeEmail.
If mail never arrives, see how to stop Seabreeze email going to spam/bulk and I didn't get my email.
Rename your login in Account Tools (/Member/Tools#rename).
You can rename your login (display / member name) from Account Tools, subject to availability and site rules.
#rename).If Tools will not let you rename (restrictions, recent change, or a special case), contact us via Feedback and include your current login name.
Change your password in Account Tools (/Member/Tools#password).
You can change your password from Account Tools.
#password to the URL).If you cannot sign in, use Forgot login / password instead.
Allowlist seabreeze.com.au and mark Not spam in Gmail, Outlook, Apple Mail, etc.
Mail apps and providers often file unfamiliar senders under Spam, Junk, Promotions, or Bulk. Help Seabreeze mail land in the inbox:
seabreeze.com.au → Never send it to Spam.Also confirm the email on your account under Account Tools. Still missing mail? See I didn't get my email.
Check spam, allowlist Seabreeze, retry /Forgot, then Feedback if needed.
Activation and password emails are sent automatically. If nothing arrives:
Still stuck? Feedback — tell us the address you expected the mail on (not your password).
Open /Messages/Threads while signed in — PMs are not on the old profile pages.
Private messages are still on Seabreeze — they live under Messages, not the old classic profile pages.
/Messages/Threads).From there you can read threads and compose a new message.
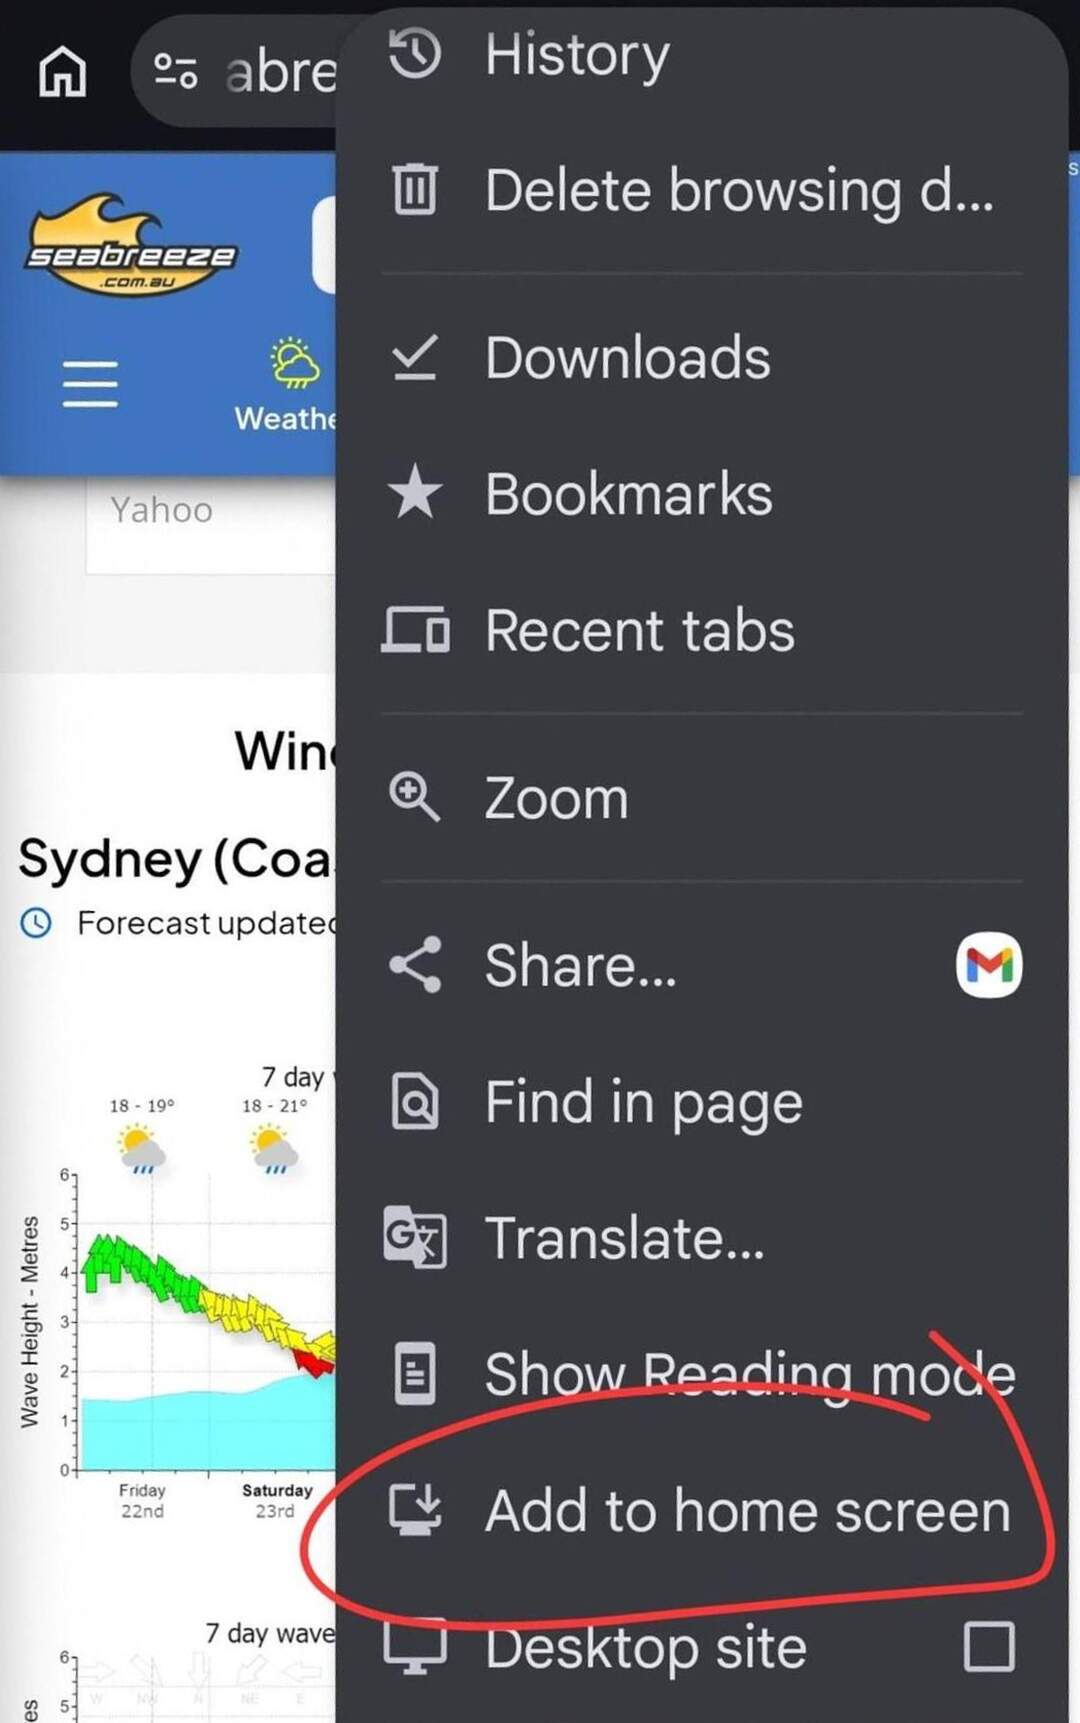
You can add Seabreeze to your phone or tablet home screen so it opens instantly - no typing a URL, no hunting through browser tabs, just tap and go.
It takes about 10 seconds on either Android or iPhone, and the icon sits right on your home screen like any other app.
On Android: Chrome menu, then "Add to Home Screen". On iPhone: Safari Share button, then "Add to Home Screen".
Adding Seabreeze to your home screen is the fastest way to check the forecast before you head out - tap the icon and you're straight into wind, tides, and swell without opening a browser first.
It works on any Android phone or tablet using Chrome, and on any iPhone or iPad using Safari.
On some Android versions you'll be asked to drag the icon into position - just drop it wherever you want it.
On iPhone and iPad, this only works from Safari - it won't show the option in Chrome or other browsers on iOS.
"Takes 10 seconds. Saves you 10 seconds every single time you want to check the forecast."
The icon looks and works like an app - tap it and Seabreeze opens full screen, straight to your last location.
No typing, no searching, no navigating through browser history.
Perfect for the quick check before you leave the house, or the tide lookup when you're already at the ramp and running on mobile data.
Set it up once at seabreeze.com.au and you're done.
Why strong wind is green, how to reverse colours, and why arrows point where the wind goes.
Seabreeze wind arrows answer two questions at once: direction (where the wind is going) and strength band (colour).
On many charts red means danger. When Seabreeze was first invented, it was fora wind addict, so red was used for dull (no wind), and green used for Go Go Go! And so it remains... but ... you can ..
Prefer red-for-strong? Use (
/weather/ReverseGraphs
). Your choice is remembered in the browser (cookie, or profile if logged in).
Arrows point where the wind is going (downwind), not the compass direction the wind is coming from.
Only the on-site recent history tools — no custom long-range history exports.
We do not offer custom multi-year wind history exports for arbitrary dates beyond what is already on the site.
On each location's weather pages you can use the history / recent observations tools that ship with that location (typically recent days of live wind, not decades of archive downloads).
For a specific research dump of raw values for a past calendar day, see raw wind data — that is generally not available as a personal export service.
Raw personal exports are not available — use the on-site graphs and observations.
It would be great to offer one-off raw extracts for a chosen date, but we do not provide personal raw wind data exports.
Please use the graphs and observation views already published for each location. Bulk or historical research access is not a supported helpdesk service.
Embed widgets from /weather/shared.
Yes — we publish embeddable weather widgets.
See the current options at /weather/shared (the old /widget.asp address redirects here).
Follow the instructions on that page for panel types, location, and styling. Please do not scrape or hotlink unpublished internals.
Tap the star on any wind graph, then open My Weather to see your custom layout. It works in this browser without logging in; log in if you want the same favourites on another device.
Most of the time the standard weather layouts are enough. When you want your own mix of graphs - for example Perth metro next to south-west forecasts - use favourites.
If the layout does not remember your choices, allow cookies for this site. Favourites are stored in the browser (and with your account when you are logged in).
The Synoptic Chart is the big picture view of pressure across the country, the highs, lows and fronts that actually create the wind you see forecast for your beach. Reading it gives you a sense of why the forecast says what it says, and what's likely coming after it.
The wind graph tells you what's expected at your location. The synoptic chart tells you why, by showing the whole weather system responsible. Once you can read one, forecasts start to make a lot more sense, and you get an intuitive feel for what's coming a few days out.
An H marks a high pressure system, generally calmer and clearer. An L marks a low, usually unsettled and windier. The lines circling each system are isobars, and wind flows roughly along them, clockwise around a high and anticlockwise around a low in the southern hemisphere. Where the lines are drawn close together, expect stronger wind; where they're spread wide apart, expect it to be light.
A line marked with triangles or half circles is a front, the boundary between two different air masses. Fronts are usually where weather changes fastest, a wind shift, a burst of rain, or a temperature drop. Watching where a front sits relative to your coastline is a good way to judge how soon a change will actually arrive.
For a fuller explainer with more examples, see How to Read a Synoptic Weather Chart . See also How does the weather work?
The Rain Radar shows live Bureau of Meteorology rainfall over your area, with a short timeline you can play back and forward. Use it to see whether rain is actually heading your way, from how far off, and how fast it's moving.
A forecast tells you the chance of rain today. The radar tells you where the rain actually is, right now, and which way it's drifting. That difference matters when you're deciding whether to launch, paddle out, or just wait twenty minutes for a passing shower to clear.
Colour is intensity. Light blue or green is drizzle and light rain, yellow and orange is heavier rain, and red through to purple is intense, often thundery rain. A blob doesn't tell you much on its own; watch it for a couple of frames and you'll see whether it's building, weakening, or simply sliding past.
The bar along the bottom is the important part. It plays back the last few hours of radar so you can watch a system's actual track and speed, rather than guessing from a single frame. Drag it yourself to step through history, or let it run and watch the pattern repeat.
The wider views are a mosaic of several separate Bureau radars stitched together, so on rare occasions you might notice a faint seam where two stations' coverage meets. That's a stitching artefact, not missing rain.
For a deeper dive into radar colours and storm cells generally, see How to Read Australian Weather Radar . If you've ever wondered why the radar shows rain when the sky looks clear, see Why does the Rain Radar show rain when it isn't actually raining?
Wind Alerts text you the moment live conditions at a chosen station cross a threshold you set. Forecast Alerts send a scheduled daily text summarising the outlook. Both need you to be signed in and carry a small amount of prepaid SMS credit.
Not everyone wants to open an app first thing to decide whether the day is worth it. A Wind Alert fires the instant your chosen station crosses the direction and speed you set, so you find out the moment it's actually on. A Forecast Alert instead sends a daily text summarising what's coming, so you know the outlook before you're even properly awake.
From the Alerts page, adding a Wind Alert lets you choose the station, direction and minimum speed that should trigger a text. Adding a Forecast Alert lets you choose a location and the time of day the daily summary should arrive. Either can be edited or removed at any time from the same page.
Each text uses a small amount of prepaid credit, topped up from the same page. A member can register their own mobile plus additional numbers underneath it, which suits a family or a crew who all want the same alert without everyone setting one up individually.
Surf and beach cameras let you see actual conditions before you commit, swell size, wind texture on the water, how crowded it is, the sort of detail a numeric forecast can't fully capture.
A forecast graph gives you the average expectation. A camera gives you the truth on the day: whether it's glassy or wind-blown, whether the swell has actually filled in yet, and the difference between sets and lulls that no single wave-height number shows. Checking the cam before a long drive can save the drive entirely, or confirm it's worth every minute.
Cameras come from a mix of sources, some run directly by Seabreeze, others shared by local councils or state transport departments, and most refresh periodically rather than streaming true video. A timestamp burned into the corner of the image tells you exactly how fresh the view is, worth a glance before you read too much into a single still frame.
The Live Swell Graphs tab pairs the camera vision with numbers from a nearby wave buoy where one exists, useful for putting an actual figure on what you're seeing. Some locations also offer a panorama camera you can pan around, handy for checking wind direction and texture across a whole bay, or comparing several breaks from a single view.
Wind, pressure, seabreeze timing — and how to use Seabreeze graphs with that in mind.
Wind Glorious Wind… If your sport runs on breeze (or you are hiding from it), it pays to know what the graphs are trying to say.
Wind is air moving from higher toward lower pressure. Heating, cooling, and the land/sea contrast bend that flow — the classic afternoon seabreeze is cool marine air drawn inland when the land bakes.
Reading forecasts: look for timing (when it fills in), direction (onshore/cross/offshore for your beach), and whether gusts will turn a “nice 15” into a messy 22. Models smooth reality; cliffs, rivers, and lagoons punch holes in that smoothness.
On Seabreeze: use the wind graphs as the primary tool, compare nearby locations, and treat single-hour miracles with suspicion. Humour stays welcome; physics still wins.
Deep dives: how to read the wind graphs, Beaufort, when forecasts miss, arrows & colours.
Time across, speed up the axis, arrows show where wind goes; use gusts and neighbours.
Wind graphs are the heart of Seabreeze weather. Here is how to read them on the current site.
Forecast graphs are model guidance. Live traces are observations. When they disagree near the coast, local effects often win for a few hours — see why forecasts feel wrong.
Screenshot or save the on-page graph — bitmap mode is gone.
Graphs are drawn in the browser (not a separate “bitmap mode” download). If you want access to a "bitmap" version, just add "/bitmap" to the Url, and the images become bitmaps. Easy.
To keep an image:
Yes — weather times use local time, including daylight saving.
Yes. Times and dates on Seabreeze weather pages use local time for the location, including any current daylight saving adjustment for that state/territory.
When a region starts or ends daylight saving, graph and forecast labels move with local civil time — you do not need to add or subtract an hour yourself.
The moon phase and its rise and set times matter more than most people expect near the coast. They drive how big your tides swing, and they decide how much natural light you'll have for an early start or a late finish.
Sailors and anglers watch the moon for a reason that has nothing to do with romance. Around new moon and full moon, the sun and moon line up and pull together, producing spring tides, the biggest swing between high and low. Around the half-moon points, they're pulling at angles to each other, producing neap tides, the smallest swing. Glancing at the moon phase is a quick way to guess how strong the tidal push and pull will be, without opening the tide chart at all.
Each day's tile shows the phase itself, illustrated, with rise and set times underneath. The illumination percentage tells you exactly how full the moon is that night, useful for judging how much natural light you'll actually have if you're planning a dawn or dusk session.
Moonrise doesn't always happen before moonset in the list, and that's not an error. Around full moon, the moon rises close to sunset; around new moon, it rises close to sunrise. Which one lands first in the day genuinely changes through the month. A small reverse-order toggle near the Sun and Moon times lets you flip the display if you find the other order easier to follow.
Almost always this is either ground clutter near the radar station itself, or rain that's falling from a higher altitude and evaporating before it reaches the ground. It isn't a fault with the page.
Radar doesn't measure rain on the ground. It measures moisture reflecting off a beam that travels in a straight line while the earth curves gently away beneath it, so the further you are from the station, the higher above the ground that beam is actually sampling.
Close to a radar station, solid objects such as hills, buildings, wind turbines, or even birds and insects can scatter the beam back and show up as a patch of light green that never quite matches real weather. Further out, the beam can be sampling rain that's still high in the cloud and evaporates before it hits the ground, a phenomenon meteorologists call virga.
Real rain moves. Play a few frames on the timeline and a genuine system tracks steadily in the direction of the wind, building or fading gradually. Clutter tends to sit in exactly the same spot, frame after frame, usually right around the radar site marked on the map, regardless of what the wind is doing.
See How do I use the Rain Radar? for the full picture, including the timeline and range controls.
See Arrow colours and wind direction.
This topic is now part of the combined guide.
See Arrow colours and wind direction.
This topic is now part of the combined guide.
See What is the Beaufort Scale?
Use the Beaufort article (same scale, kept up to date there).
Every location's Tides page shows the next few highs and lows right now. The Tide Calendar zooms out to a full month at a glance, which is much easier for planning a trip weeks ahead than paging through single days.
If you only need today's tide, the Tides page is quicker. But if you're planning around a low-tide reef walk, a boat launch, or a fishing trip a few weeks out, the calendar lays the whole month out at once so you can spot the best days without clicking through one at a time.
Each cell holds a small tide curve for that day, plus the time and height of every high (marked H) and low (marked L). Heights are measured against a fixed chart datum for that location, so they're best compared day to day rather than expected to line up with round numbers.
Every warning shown on Seabreeze comes straight from the Bureau of Meteorology. We mirror the live feed next to your forecast so you see it without needing a separate visit to a government site, but the Bureau decides what's issued, not us.
Severe weather, marine, flood, and other official warnings are issued by the Bureau for a reason: something in the area genuinely needs attention. Always treat the Bureau's own advice as the authority, and use Seabreeze's warnings page as a convenient window onto it rather than a replacement for it.
The coloured outline traced on the map is the actual warned area, drawn from the Bureau's own boundary data, so it's worth zooming in if your exact spot sits near the edge. Choosing a state along the top narrows the list to that state; opening any individual warning shows its full text alongside a map zoomed to the affected area.
A compact warnings card also appears on the Rain Radar, Marine Forecast, and other location pages, so a live warning surfaces right where you're already checking conditions rather than only on a dedicated page you'd have to think to visit.
See How do I use the Rain Radar? and What is the Marine (Coastal Waters) Forecast?
Nearby Observation Stations lists every live weather station within range of a location, so you can see what wind and temperature are actually doing at the beach, hill or island next door, not just at your one primary spot.
Wind along the coast is very local. A headland, a hill, or even a line of buildings can add or strip away several knots compared with a station only a few kilometres away. A single number for "your" location is a useful starting point, but a spread of nearby readings shows the real pattern moving through, which is far more useful when you're deciding whether it's worth the drive.
Live temperature and apparent temperature, rain since 9am, wind speed and gust with a direction arrow, humidity, pressure, and, where the station has the right sensors, delta-T and dew point. Delta-T is handy for judging fire-weather style dryness and thermal potential; a blank column simply means that particular station isn't fitted with that sensor.
The small panel next to the table shows your reference location's own live wind as a compass rose, drawing on the same feed as the table so the two stay in sync as new readings come in.
See Where are the wind readings for XYZ taken from? and Why are the wind readings wrong?
One Settings panel controls every unit Seabreeze displays (wind, wave, tide, temperature and rain), the site's appearance, and which colour means "strong wind" on every arrow across the whole site.
Weather Settings sits in the same place as Favourites and Help on every weather page's side menu, so it's always one step away no matter which forecast you're looking at. Changing anything here updates every graph, table and forecast across the site immediately, there's no need to set it more than once.
Wind speed offers knots (the sailing and aviation standard), km/h (what the news uses), m/s (favoured by some technical and model users), and "Km/h + Knots", the classic Seabreeze dual display showing both together. Wave and tide height switch between feet, still how a lot of surfers talk swell size, and metres, the official Bureau unit. Temperature switches between Celsius and Fahrenheit, and rain between millimetres and inches.
Choose Light, Dark, or System default, which follows your device's own setting automatically and switches with it. Subscribers unlock a handful of extra colour palettes, Ocean, Mist, Slate, Graphite, Spice, Sage and Plum, if you'd like the site to look like more than just light or dark.
This is the one setting worth actually understanding rather than guessing at: choose whether red or green marks the strongest wind on every arrow, graph and station table site-wide. There's real history behind why Seabreeze offers both conventions side by side, covered in full in Arrow colours and wind direction .
See Swell, Waves & Seas — wave height is significant wave height for that sea state.
This is explained in the swell / waves / seas article.
→ What's the difference between Swell, Waves & Seas?
Short version: forecast wave height is the significant wave height for the sea state being described (not every individual ripple), and swell vs wind-sea are called out separately when the product provides them.
Beaufort force table in km/h and knots, with land and sea descriptions.
The Beaufort scale is a way of describing wind strength by what it does on land and at sea — useful when a knot number alone does not paint the picture.
| Force | Term | km/h | knots | On land | At sea |
|---|---|---|---|---|---|
| 0 | Calm | 0 | 0 | Smoke rises vertically | Sea like a mirror |
| 1–3 | Light winds | ≤19 | ≤10 | Wind on face; leaves rustle | Small wavelets, glassy |
| 4 | Moderate | 20–29 | 11–16 | Dust/paper lifts; small branches move | Small waves; frequent white horses |
| 5 | Fresh | 30–39 | 17–21 | Small trees sway | Moderate waves; many white horses |
| 6 | Strong | 40–50 | 22–27 | Large branches move; wires whistle | Larger waves; more foam/spray |
| 7 | Near gale | 51–62 | 28–33 | Whole trees move; hard to walk into wind | Sea heaps up; foam streaks |
| 8 | Gale | 63–75 | 34–40 | Twigs break; progress impeded | Moderately high waves; spindrift |
| 9 | Strong gale | 76–87 | 41–47 | Slight structural damage | High waves; dense foam streaks |
| 10 | Storm | 88–102 | 48–55 | Trees uprooted; considerable damage | Very high waves; sea turns white |
| 11 | Violent storm | 103–117 | 56–63 | Very rarely inland — widespread damage | Exceptionally high waves; long foam patches |
| 12+ | Hurricane | ≥118 | ≥64 | Air full of foam/spray; visibility wrecked |
See Swell, Waves & Seas.
Covered in the fuller glossary article.
The Marine Forecast is the Bureau of Meteorology's official worded Coastal Waters forecast, the same product used for boating and shipping safety, covering weather, wind, seas and swell for the wider zone off your coast.
It reads differently to the graphs you're used to, and that's by design. The wind and wave graphs are Seabreeze's own model-driven forecast, tuned for watersports and shown as a visual timeline for a specific spot. The Marine Forecast is the Bureau's plain-English forecast for the whole coastal zone, written with a wider safety margin because it has to cover everyone from a tinny to a tanker.
"Seas" describes the local, wind-driven chop right now. "Swell" describes longer, more organised waves that have travelled in from a weather system somewhere else, sometimes a very long way away. A forecast of small seas with a solid swell running is common, and means the wind might feel gentle while there's still real size in the water.
Wording like "becoming" or "increasing" describes how conditions change through the period, not a single fixed number, so read the whole sentence rather than just the first figure. It's written for planning a day on the water, not for picking the exact hour to launch.
See What's the difference between Swell, Waves and Seas? and What are the Weather Warnings, and where do they come from?
Seas = local chop; swell = travelled longer-period energy; wave height ≈ significant height.
Seas are the short, local chop created when wind blows on the water nearby. Given enough time and fetch, that energy organises into longer swell.
Swell is the longer-period wave energy that has travelled away from where it was generated — the “rock in a pond” rings that keep going after the wind at your beach has changed.
Waves (in surf talk) are usually what you want to ride: organised swell that stands up on the reef or sandbank. Forecast “wave height” is typically significant wave height for that sea state — not every tiny ripple, and not always the single biggest set of the day.
Seas can sit on top of swell and spoil a session even when the swell height looks perfect on paper.
Each location maps to a specific station/feed — see the live wind labelling.
Each live wind location is tied to a specific observation source (a named station or feed). On the location’s weather pages, look for station labelling / about info on the live wind panel.
Readings are not claimed to be mid-bay at mast height for every sport. If two nearby locations disagree, both can be “right” for their sites.
Sea temperatures are under Weather at /weather/sea-temperature/… (pick your state slug). Classic seatemp.asp links are gone.
Sea temperature pages live under Weather:
/weather/sea-temperature/western-australia (and the same pattern for other states, e.g. new-south-wales, queensland).
You can also reach sea temperature from the Weather menus when the product is enabled. If the page says it is temporarily unavailable, that is a site-wide switch — try again later or use Feedback.
The old *_seatemp.asp graph links are retired.
Asked no-one ever.
See also: why forecasts can be wrong.
Pretty correct for me, most of the time. Glad you're agreeing!
For the flip side (and a straighter explanation), see Why are the forecasts so wrong? .
Forecasts can miss — coastal wind is hard; compare models and neighbours.
Sometimes they will be — weather is chaotic, and coastal wind is especially fiddly.
Also see different to the BoM, different to other sites, and how the weather / seabreeze works.
Meters report their site, not your exact launch — learn local bias.
Live meters measure where they are mounted — not always the exact corner of the bay you need. Height above ground, sheltering, terrain, and distance from the water all bias a reading. Let alone finding a location which has power, security, maintainability, communications... as the rolling stones said ... "you can always get what you want" ...
Compare a few nearby stations, and learn your spot’s usual offset versus the graph.
Almost always it's one of three things: the SMS credit balance ran out, the alert's trigger genuinely wasn't met, or the mobile number on file is out of date.
Alerts fail silently by design rather than emailing an error, which is convenient right up until the one time you were relying on it. These three checks cover nearly every case.
Each text costs a small amount of prepaid credit, and once the balance hits zero, alerts simply stop sending rather than showing any warning, so a quick look at the balance on the Alerts page is always worth doing first. It's also worth confirming the alert itself is still turned on rather than accidentally removed, and that the mobile number saved on the page is current and able to receive texts, a stale number after a phone change is one of the most common causes.
A Wind Alert only fires when the live reading at your chosen station actually crosses the exact threshold you set. If the wind sat just under it, or your launch spot simply reads differently to the nearest station, no text is the expected outcome rather than a fault. Nearby Observation Stations is a good way to see the wider pattern and judge whether your threshold or station choice needs adjusting.
Contact Feedback and mention the alert type and roughly when you expected it, and it can be checked from our end.
See How do SMS Wind and Forecast Alerts work? and What can Nearby Observation Stations tell me?
See Arrow colours and wind direction.
This topic is now part of the combined guide.
See Arrow colours and wind direction.
This topic is now part of the combined guide.
Different models and presentation — disagreement is normal.
Different sites ingest different models, update on different schedules, and draw maps with different smoothing.
Two well calculated forecasts can disagree by several knots or an hour of sea-breeze timing.
It's the nature of weather. Who said all forecasts should agree? Forecasts for Property, Interest Rates and Hair Styles differ - there is no one source that is always right, but somehow, many people believe that.
BoM and Seabreeze serve different products — differences are normal.
They can be — and that is often expected.
The Bureau publishes official public forecasts. Seabreeze emphasises wind and coastal conditions for watersports, using model guidance and presentation choices aimed at that audience. Different products, different emphasis; neither is “the only truth” for every beach hour.
It's always interesting when someone writes in that a forecast is "wrong" or "different". a) it's not happened yet, and b) like interest rates and property prices, the weather will do it's own thing, regardless of what us humans predict.
More context: why forecasts feel wrong , vs other sites .
Request closure via Feedback / account tools; old public posts may remain.
Want out? Fair enough.
Use account tools where available, or Feedback to request account closure. Understand that public posts you already made may remain as part of thread history unless there is a legal/privacy reason to scrub them.
Why does this place even exist?
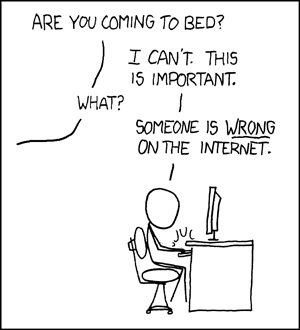
Our sport is our recreation. It's what we do for fun - it's not about getting all serious and upset, there's enough of that in the stuff we do for money.

Member rating for posts — report separately when content must be removed.
Thumbs let members rate posts. They help surface useful replies and sink junk — they are not a substitute for the report control when something must be removed.
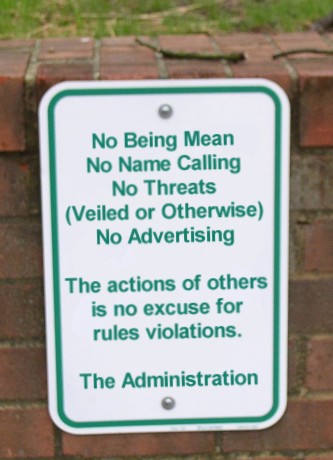
Use them in good faith; vote rings and revenge thumbs are moderated like other bad behaviour.
Report flag alerts moderators — use it for content that should be removed.
There are people who upload or post things that do not belong on a PG community site. Above posts (and in similar places around member content) you will find a report control — historically a small red flag icon.
Use it for content that should be removed (abuse, spam, illegal, etc.). Reports go to moderators; they are not a public downvote.
I'm disgusted with what someone has written, thumbs up/down.
Edits are only allowed for a short time after posting.
Forum posts are editable for a short window after you post (on the order of an hour). After that, the edit control disappears so threads stay stable.
If you need a correction later, reply with an update, or ask a moderator via report/Feedback for exceptional cases (e.g. personal info posted by mistake).
We moderate — report problems so they get into the queue.
We do. Moderation is not instant on every thread. If you see something that breaks the rules, report it rather than assuming nobody cares.
Also see Forum Rules.
Yes!
If a sale falls through, you can usually put the advert back up from My Adverts (edit / resurrect ).
If that doesn't work / not available, then write to us via Feedback
We do not vouch for traders — verify profiles, talk, agree payment/shipping, watch for scams.
Like any classifieds marketplace, Seabreeze publishes adverts — we cannot certify that a buyer or seller is genuine. Reduce risk:
Interstate deals still come down to photos, conversation, and the risk you personally accept.
Sign in and open /Member/MyAdverts to manage your listings.
Your classifieds are managed under My Adverts — not the old Members / My Adverts.aspx pages.
/Member/MyAdverts), or use the Members menu → My Adverts.From My Adverts you can edit, refresh, or remove a listing. See also how to remove a listing.
Remove listings from /Member/MyAdverts while signed in.
Remove (or end) a listing from My Adverts.
If the advert was marked sold or already expired, it may no longer appear in the active list — check filters on My Adverts list.
Wait for payment to fully clear, then add images from My Adverts.
Image uploads unlock when the listing payment is fully completed — not while a payment is still pending or held.
Check My Adverts, payment status, then Feedback if it never appears.
New and edited adverts can take a short time to show while payment clears and/or the listing is checked.
Optional but spam-prone — prefer on-site contact where you can.
You can include contact details in an advert, but expect spam harvesters to notice.
Prefer the site’s contact / messaging flow where possible. If you must publish an email, consider a dedicated address and never put passwords or payment logins in the ad text.
Can't find what you're looking for? Send us a message and we'll get back to you.