Highs, Lows and Why the Wind Changes

Quick summary
Wind is air sliding from high pressure toward low pressure, then bent by Earth's spin so it circles the systems instead of running straight downhill.
In the Southern Hemisphere that circle is clockwise around a low and anticlockwise around a high, and the tighter the isobars, the harder it blows.
The how-to
Place yourself on the chart relative to the nearest H and L and you can pick the day's direction and the likely change.
The wind on your beach is not random.
It is air trying to even out a pressure difference, then getting turned by the planet so it never quite makes it in a straight line.
What a high and a low actually are
Pressure is just weight. The Met Office treats 1013 hPa as standard sea-level pressure, and NOAA's JetStream school gives 1013.25 hPa, or 1013.2 millibars.
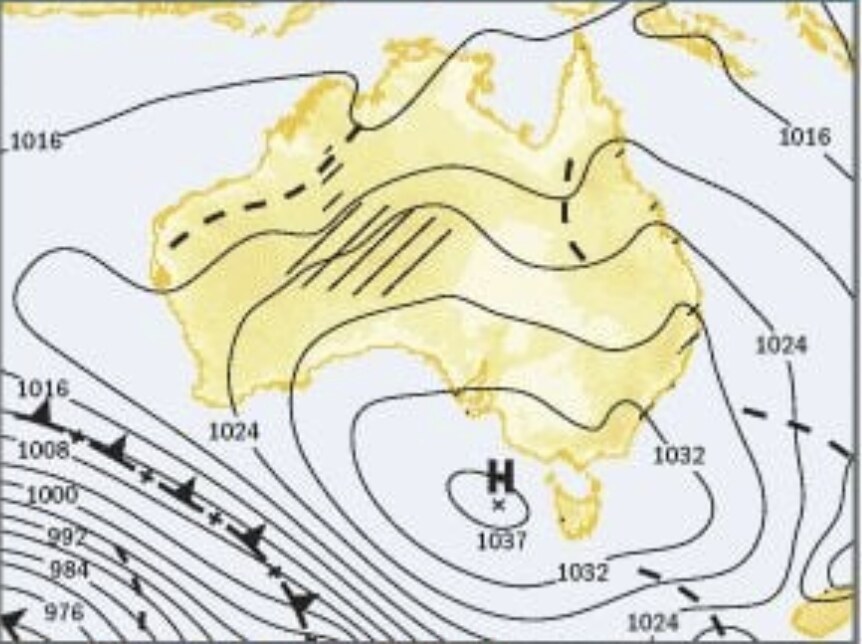
A high is a patch where that weight is greater than the air around it, marked H on the chart, with sinking air that dries and often clears the sky.
A low is the opposite: lighter air, rising motion, cloud, and usually a tighter squeeze of isobars around the L.
Isobars are lines of equal sea-level pressure, and NOAA states wind speed is directly proportional to how tightly they pack.
Close lines mean a steep slope and a hard blow.
Wide lines mean a light, shifty day, even if the high looks huge on the map.
Why the wind circles instead of running downhill
Earth's spin does the steering. If pressure gradient were the only force, air would race straight from H to L and that would be the end of it.
The Coriolis effect, described mathematically by Gustave-Gaspard Coriolis in 1835, turns moving air to the left in the Southern Hemisphere and to the right in the Northern.
Combine those two forces and the wind flows nearly along the isobars, circling the centres rather than diving into them.
Friction with sea and land then slows the flow and lets a little air leak across the lines, out of the high and into the low, where it rises, cools, and makes the cloud you can see from the ramp.
In the Southern Hemisphere, stand with your back to the wind and the low sits on your right, the high on your left.
That is Buys Ballot's law flipped for our half of the planet, the rule C.H.D. Buys Ballot published in 1857 and that still sits in Bowditch's American Practical Navigator.
Northern Hemisphere diagrams will lie to you here, so throw them out when you look at an Australian chart.
Around an Australian low the surface wind goes clockwise.
Around an Australian high it goes anticlockwise.

How a moving system changes the wind on your beach
You sit still, the pattern slides. Southern Ocean lows and their trailing cold fronts typically march west to east, and the high that follows them does the same.
On the southern and western coasts that often means a northerly or northwesterly as the front approaches, then a sharp swing into the southwest once it is through.
You feel that as a temperature drop, a rise in the barometer, and a wind that clocks and often eases as the high's centre slides closer.
On the east coast a high in the Tasman, south-east of you, feeds easterly to northeasterly flow on its north-western flank from the Gold Coast to the Hunter.
The catch is that the centre of a high is usually the worst place on the chart for wind sports.
Fair sky, yes, but the gradient collapses and you get the light-and-variable hole people blame on a bad forecast.
The usable wind lives on the flank, where the isobars are still packed and the flow has a clear direction.
When a sea breeze can rewrite the script
Local heat can beat a weak gradient. Land warms faster than the ocean, so a shallow thermal low forms over the coast and cooler marine air slides in underneath it.
NOAA describes that inland push as a sea-breeze front, and notes the air temperature can drop 8-11C (15-20F) once it goes through.
The cell only really fires when the large-scale wind is light enough to let it.
A working rule on the east coast is that a 20 knot (37 km/h) synoptic westerly usually crushes the sea breeze before it gets organised.
A weak high parked overhead is the opposite: the afternoon easterly can fill in hard even though the chart looks dead.
The night land breeze is the same engine in reverse, and NOAA notes it is usually much weaker.
How to use this before you leave the car park
Place yourself on the chart first. Find the nearest H and L, then walk clockwise around the low until you hit your coast, and that is your expected direction.
Walk anticlockwise around a high and you get the same answer.
Then look at spacing.
Tight lines on your stretch of coast mean you should be thinking about reefing or a smaller kite, not about whether it will fill in later.
A falling glass ahead of a southern front is the northerly still in charge, and a rise after the change is the high arriving, not a promise the wind will stay up.
Check wind forecast against the isobar picture, and open state warnings if one is up for your waters.
For the symbols and fronts themselves, use the companion guide on how to read a synoptic chart .
Mistakes that dump people in the wrong gear
Reading a Northern Hemisphere diagram. Clockwise and anticlockwise flip south of the equator, and that single error puts the low on the wrong side of the wind.
Treating a big high as a big-wind day, when the centre is often the hole and the wind is out on the rim.
Assuming the sea breeze will always save a glassy morning, even when a fresh offshore gradient is already in charge.
Ignoring a falling glass because the sky still looks pretty, then launching into the last of the northerly and getting dressed by the southwest change.
What to ask before the next session
Where is the nearest low relative to you, and what direction does clockwise flow around it imply on your beach?
Are the isobars tight on your coast, or are you sitting in the slack middle of a high and hoping the sea breeze does the job?
If the front is due this afternoon, do you want the last of the northerly or the first of the southwest, and is your exit still safe after the swing?
Next time you zip the kite or hoist, put your back to the wind and check: low on the right, high on the left, then look at the chart and see if the picture matches.